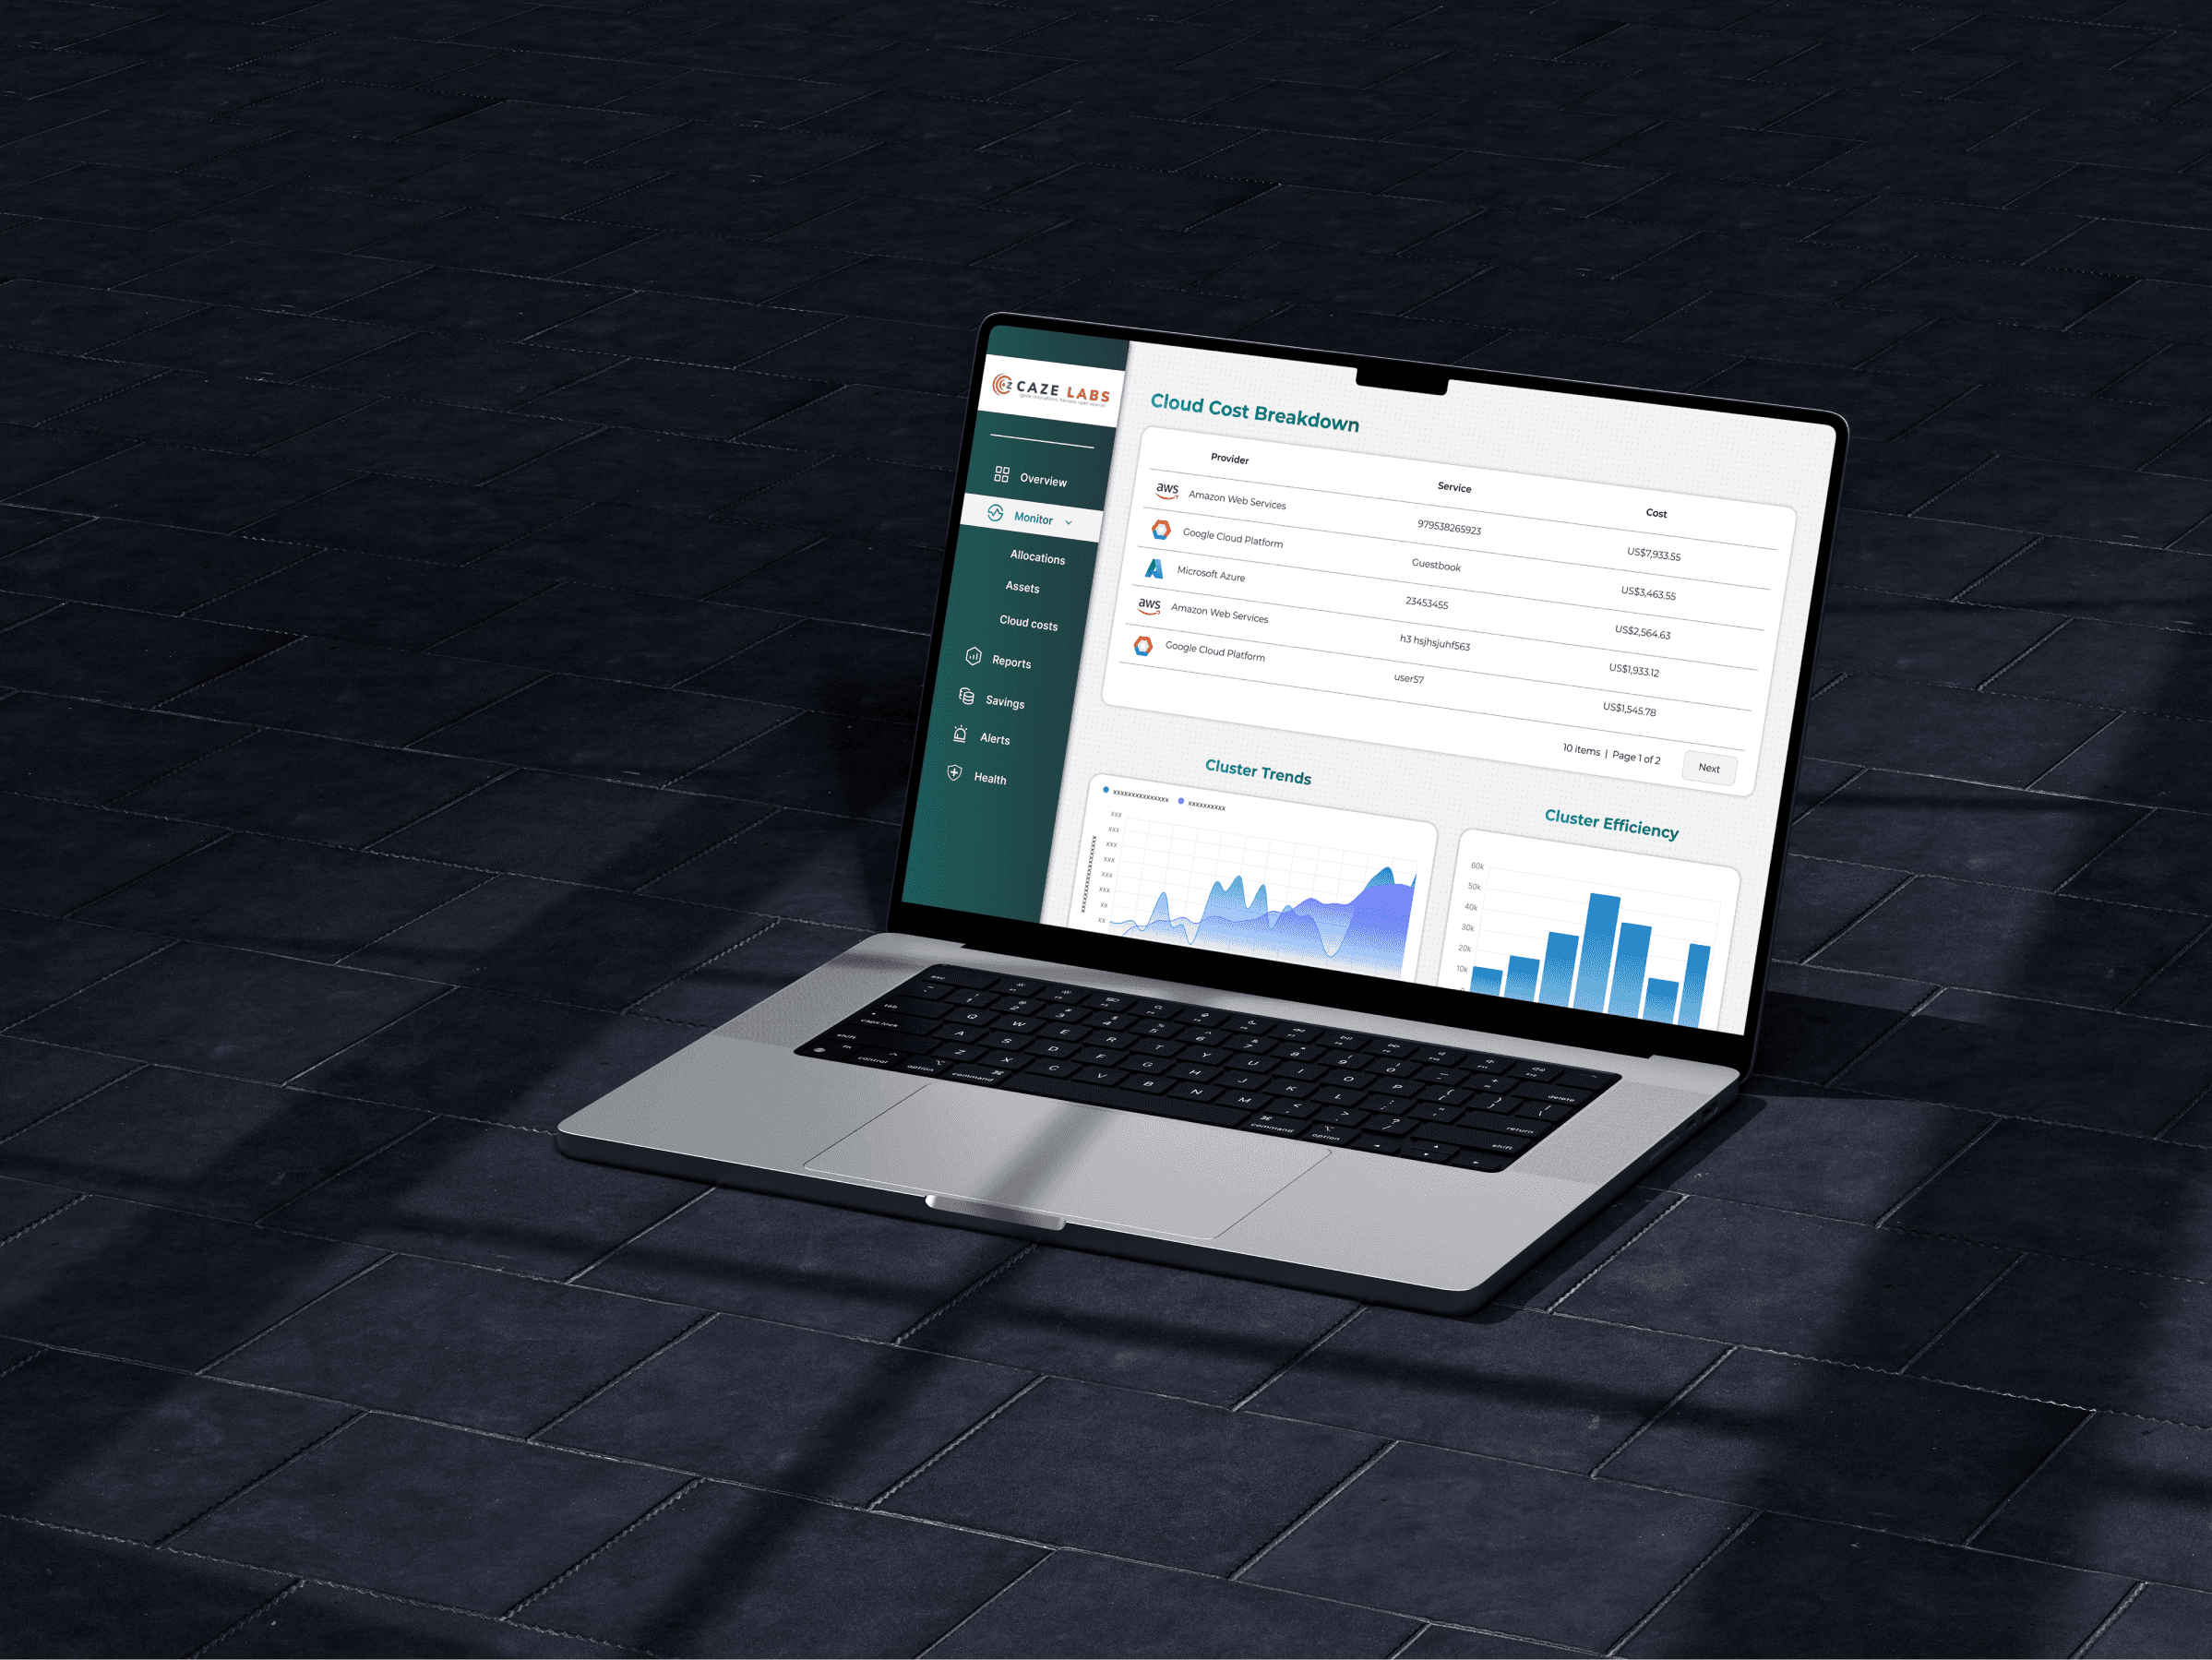
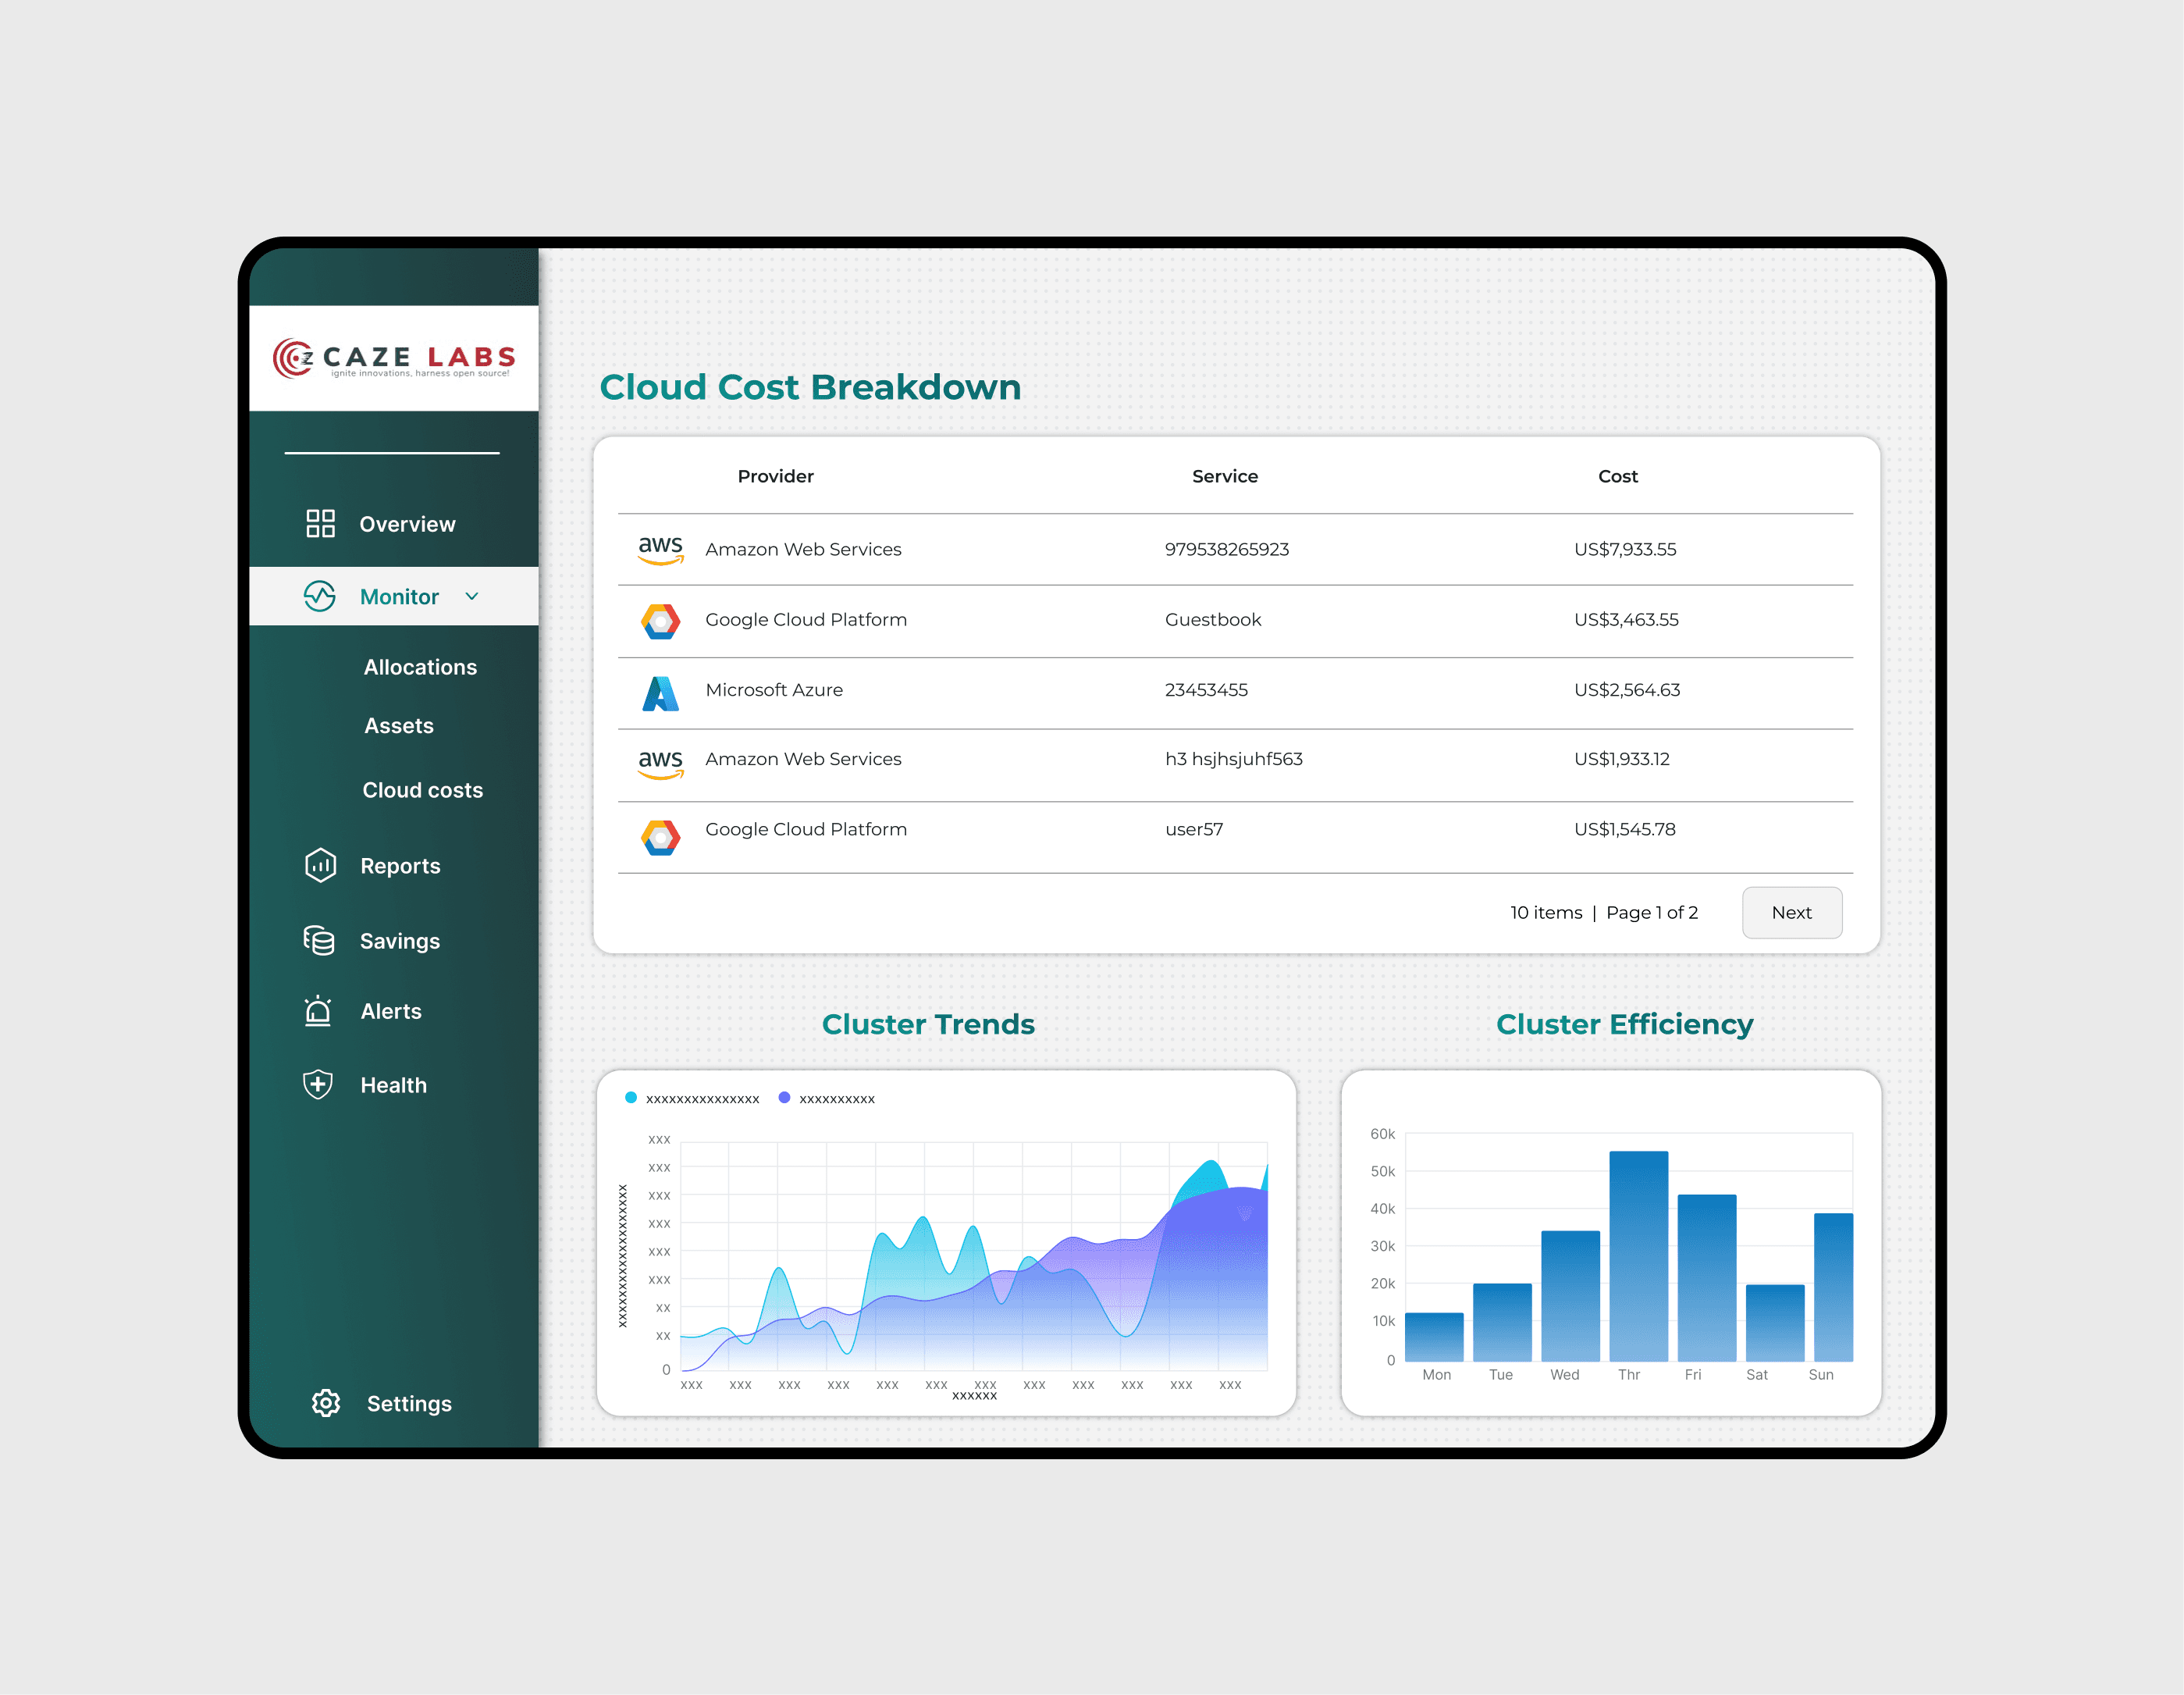
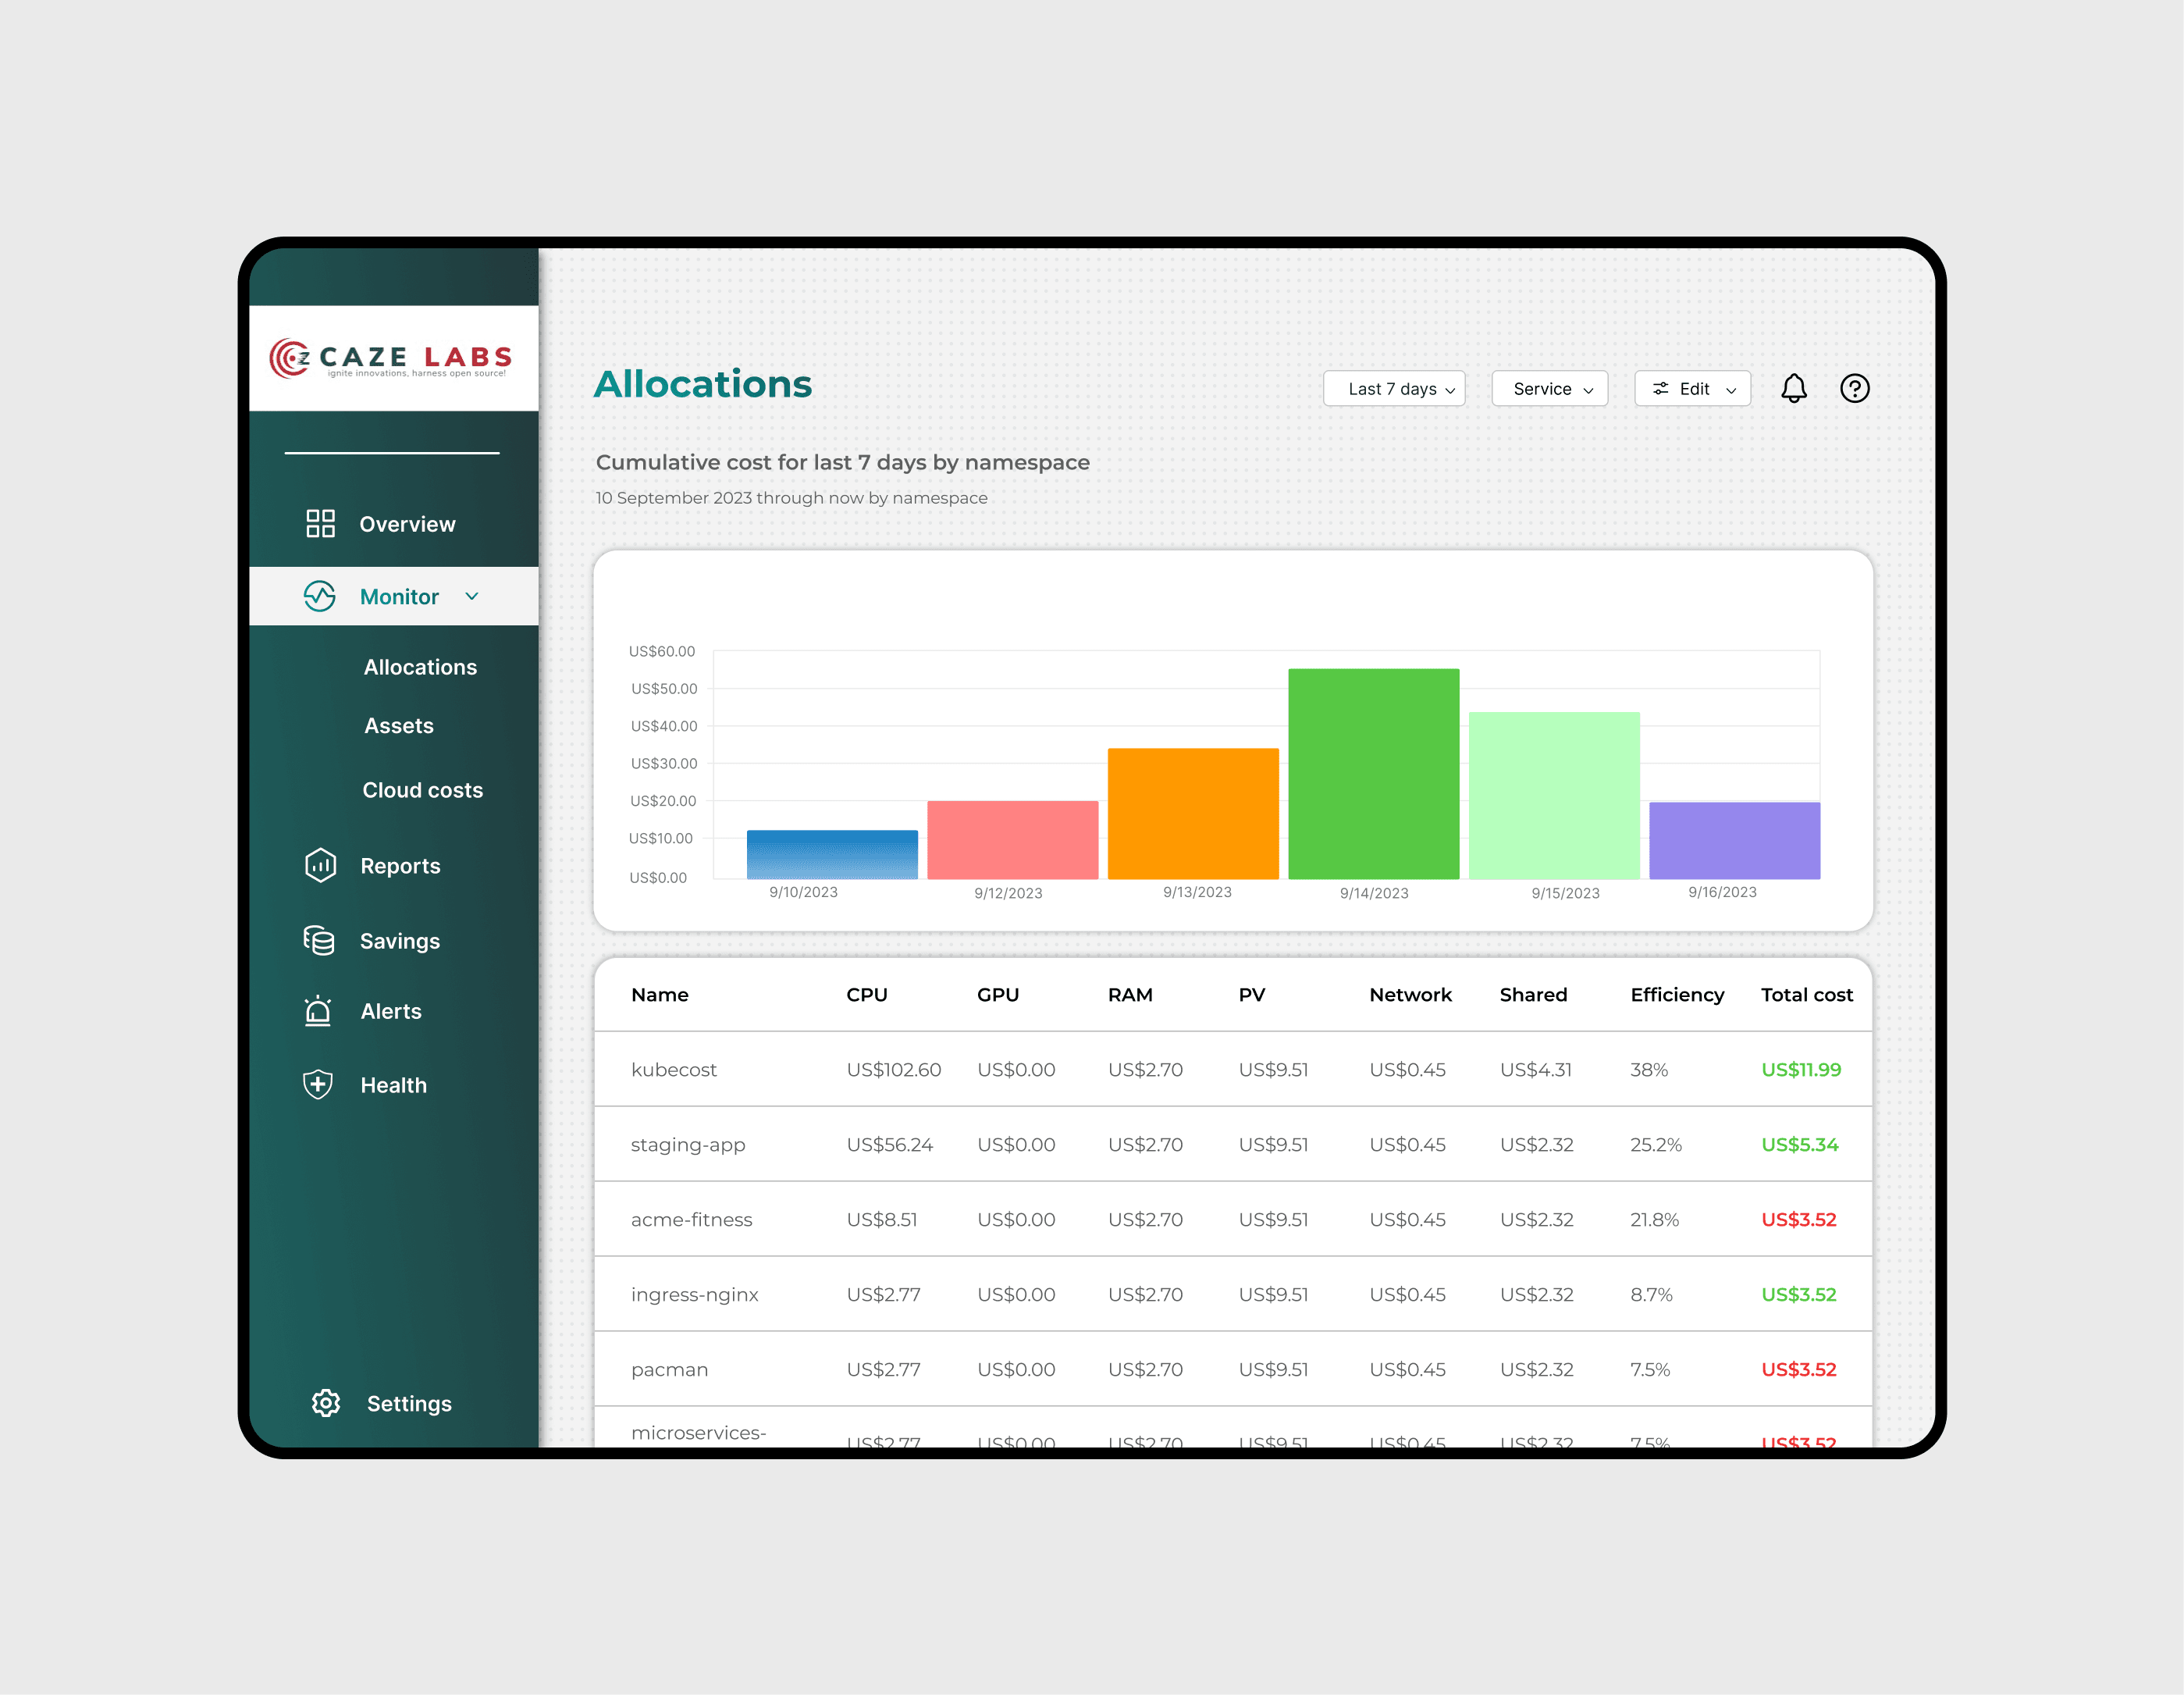
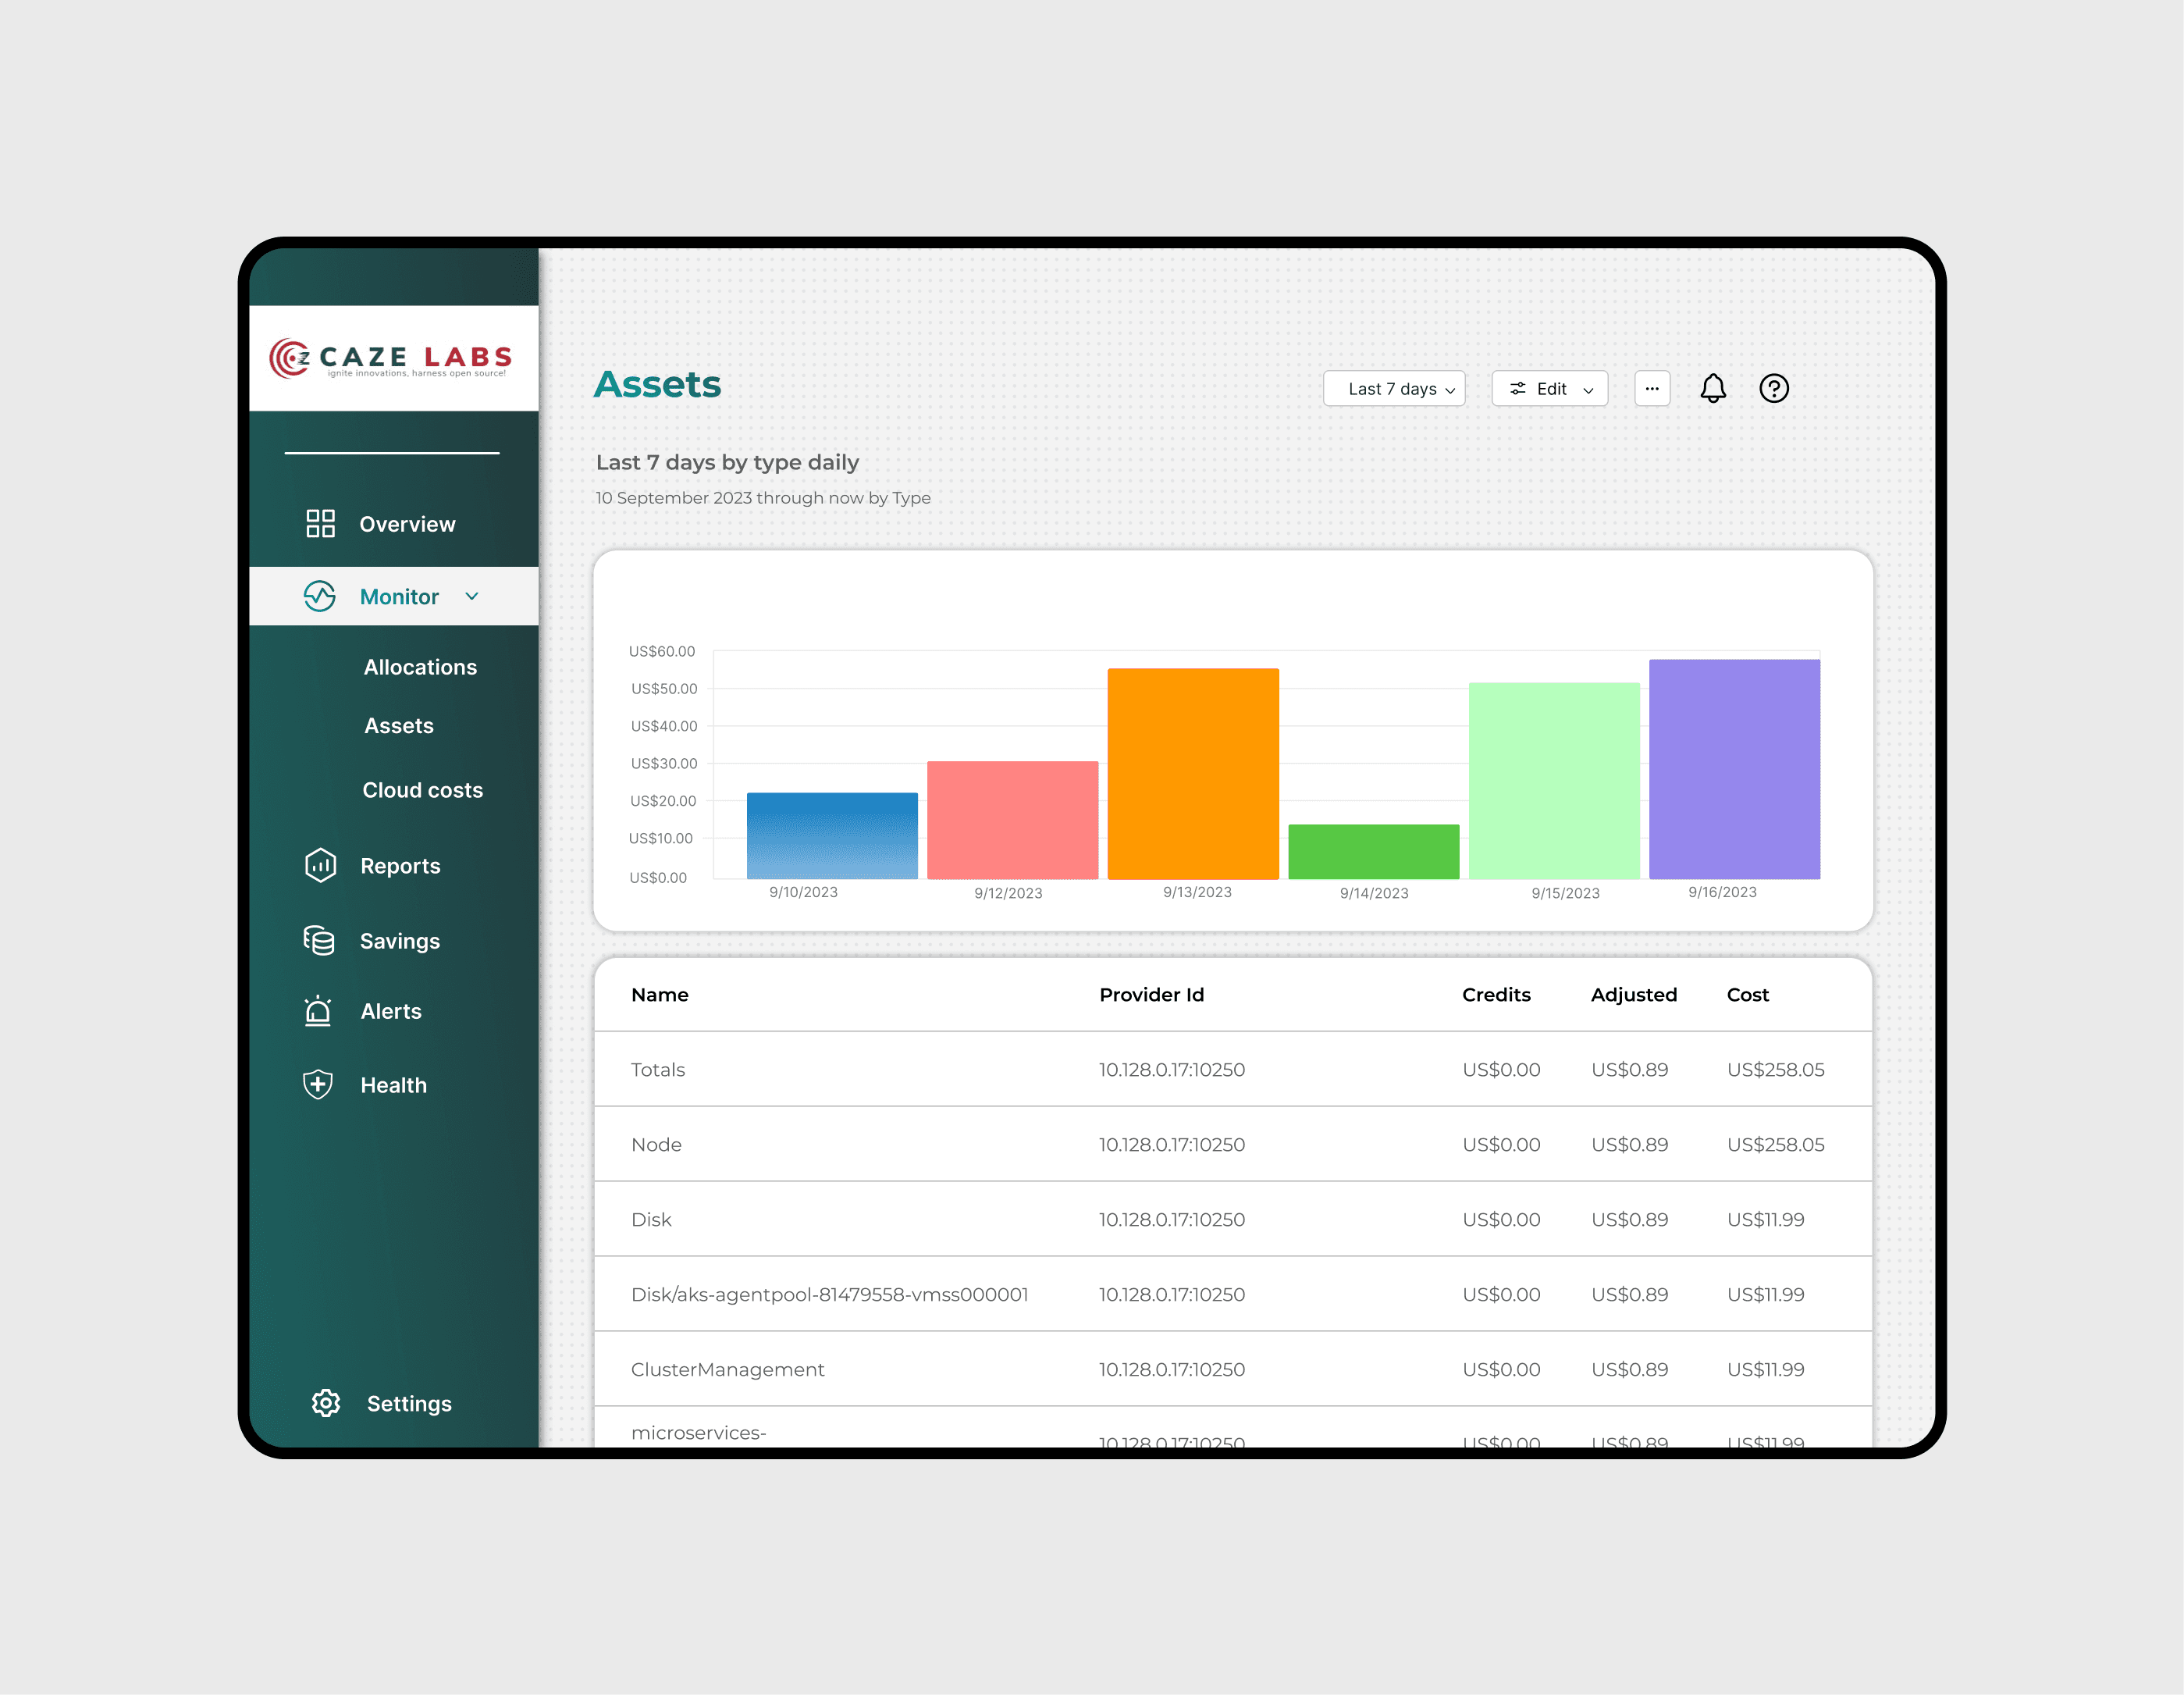
CazeLabs Cloud Dashboard offers users a unified interface to monitor, manage, and analyze cloud services. It provides real-time insights into usage, performance, and costs, helping users optimize infrastructure, deploy applications, manage storage, and track security, all in one place.
Services
UI Design, User Research, Strategy, Branding, No-Code Development
Users of cloud services struggle with fragmented tools that make it difficult to monitor, manage, and optimize their infrastructure efficiently. They need a unified dashboard that integrates real-time insights on usage, performance, costs, storage, and security to streamline cloud management and improve operational efficiency.
This project aims to design a unified dashboard for CazeLabs that enables users to efficiently monitor and manage their cloud services in one platform. The goal is to create an intuitive interface that consolidates key functionalities, providing real-time insights that help users optimize their cloud usage and save time and resources.
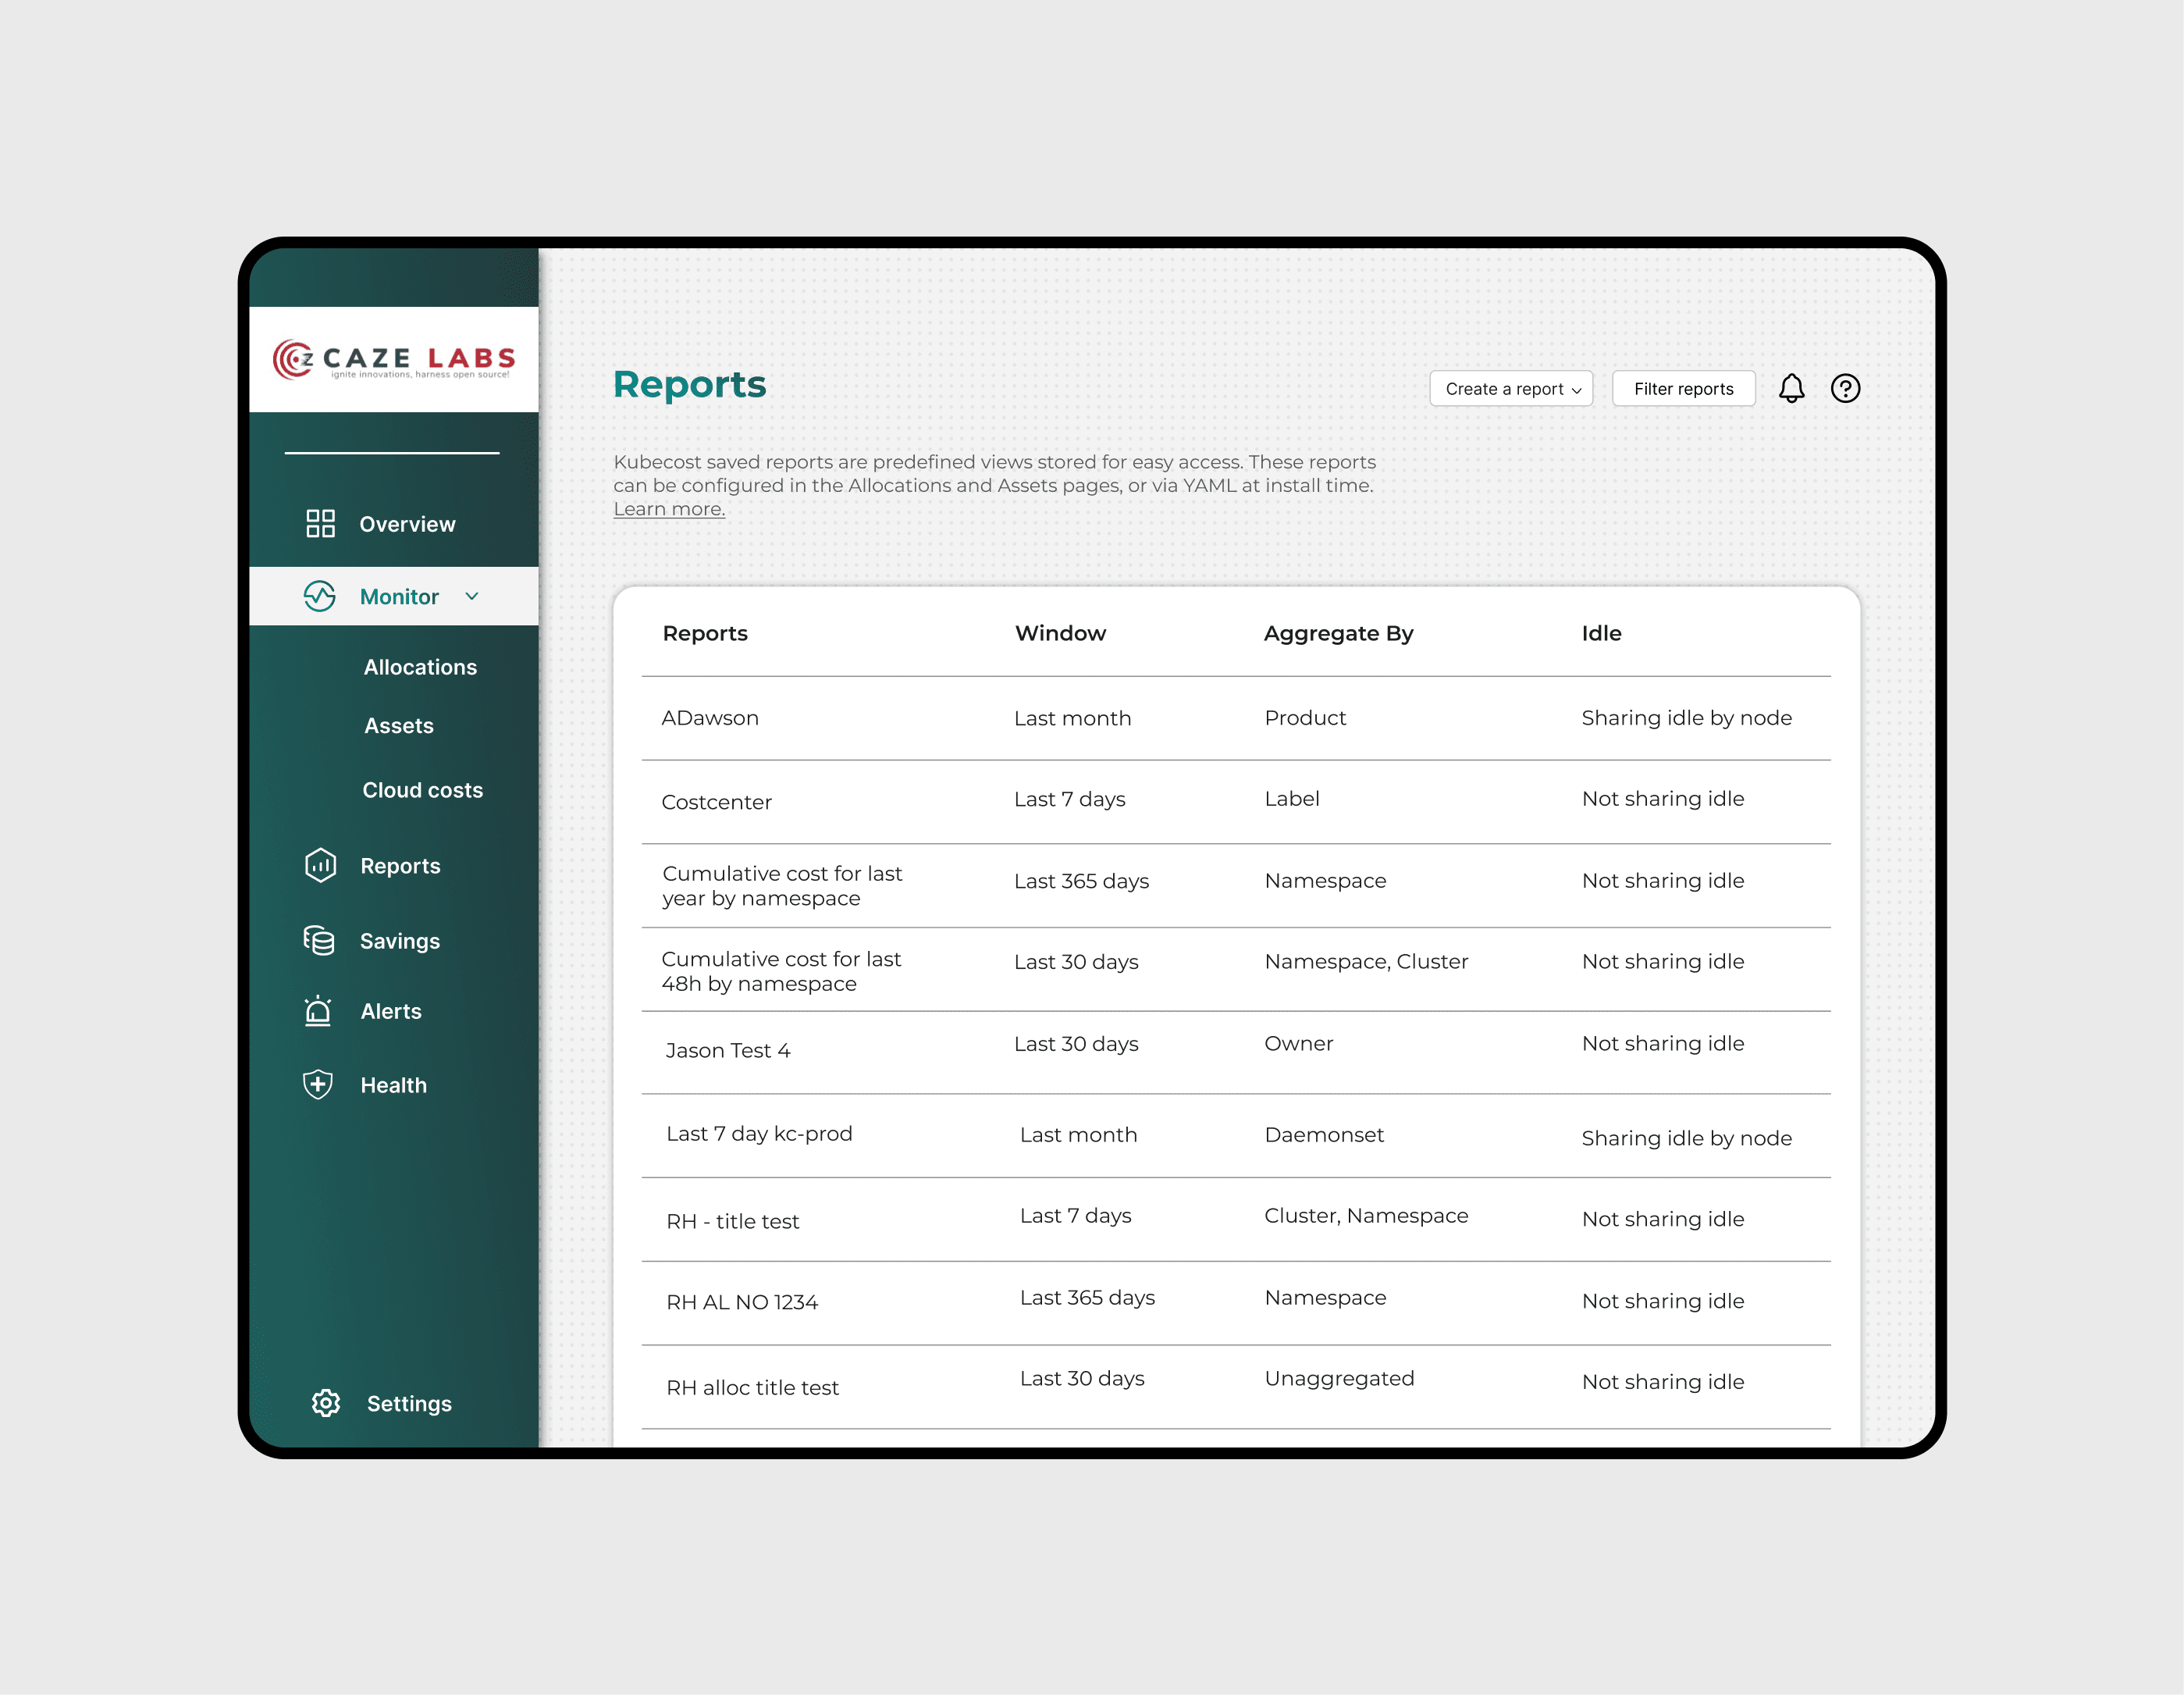
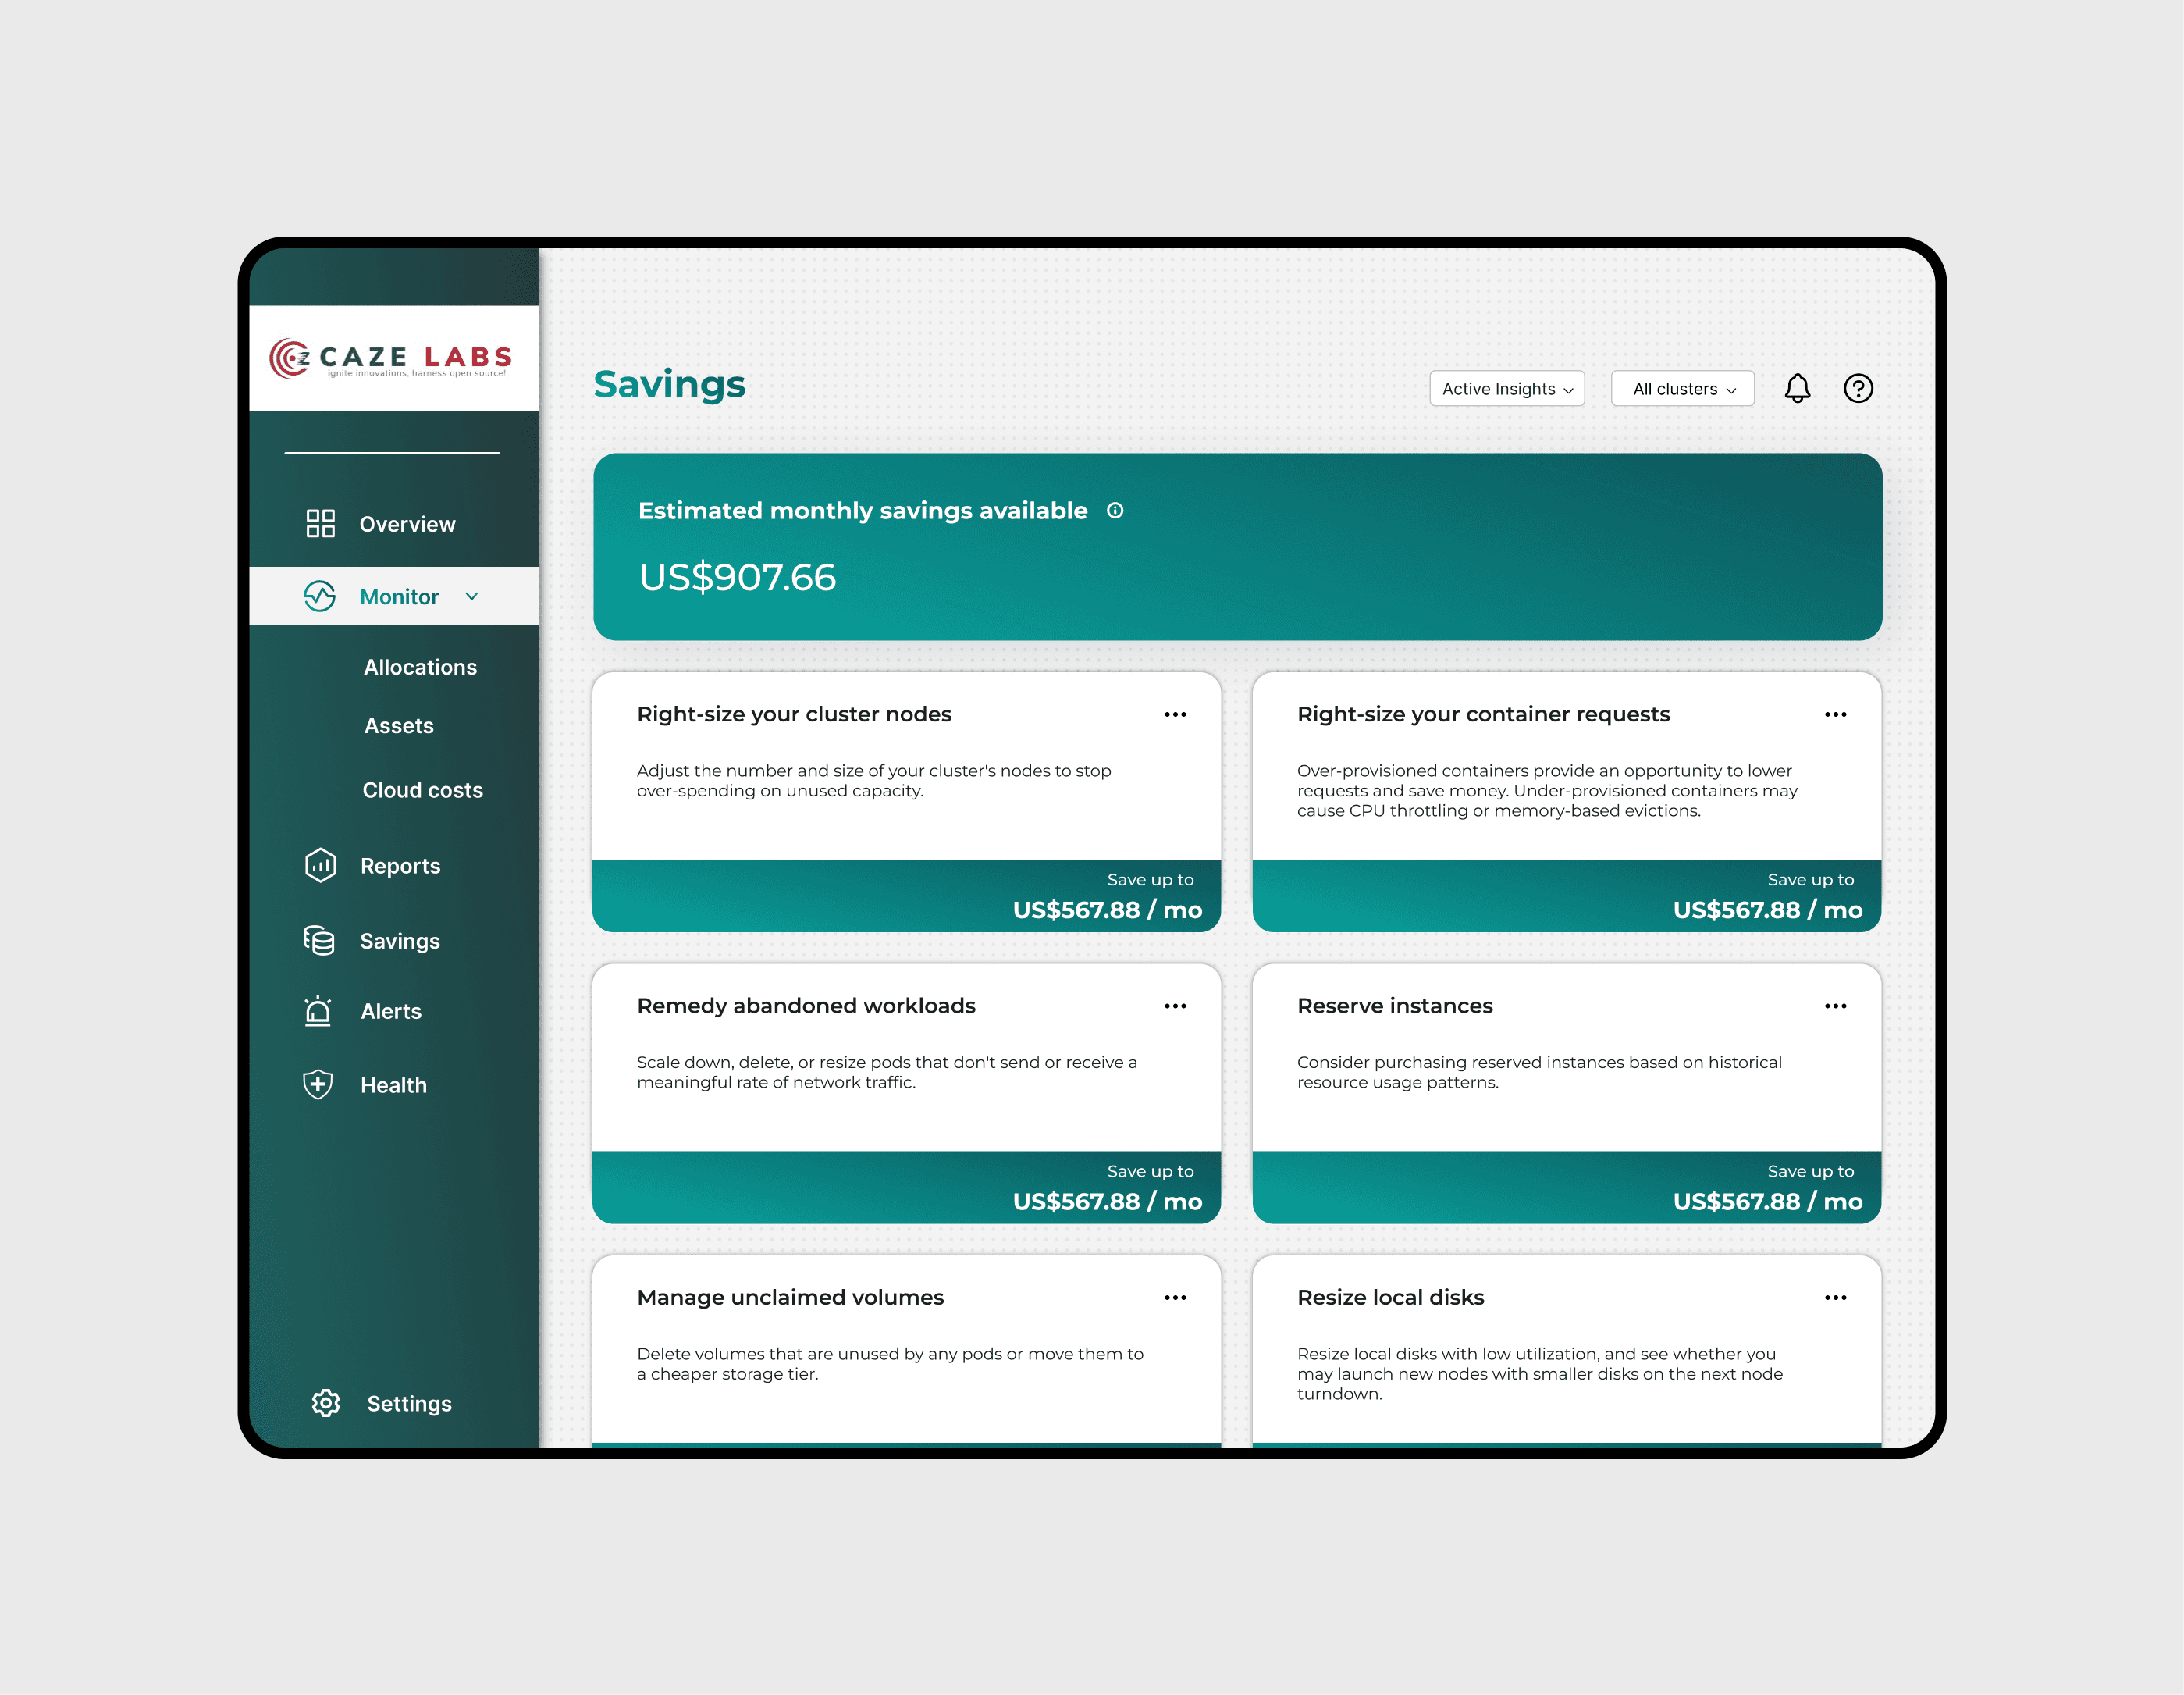
We developed a unified dashboard for CazeLabs that integrates essential functionalities into a single platform. This dashboard features a Monitor section that includes insights on cloud costs, allocations, and assets, as well as a Reports section for detailed analytics. Additionally, it has a Savings section to highlight cost-saving opportunities, an Alerts section for notifications on critical changes, and a Health section to monitor system performance.
By providing real-time analytics and an intuitive interface, we empower users to optimize their cloud usage and save time and resources.
We started by interviewing stakeholders and clients to understand their expectations and needs for managing cloud services. To ensure alignment, we held weekly meetings to sync up with all team members and discuss progress. Based on these insights, we defined key features for the unified dashboard, including monitoring costs, allocations, and assets. We created wireframes and interactive prototypes to visualize the user flow and gather feedback. After refining the design through user testing, we collaborated with the development team to implement the final dashboard. Post-launch, we continued to gather user feedback for ongoing improvements.